ROYCE Mining Telemetry and Analytics Increases Productivity
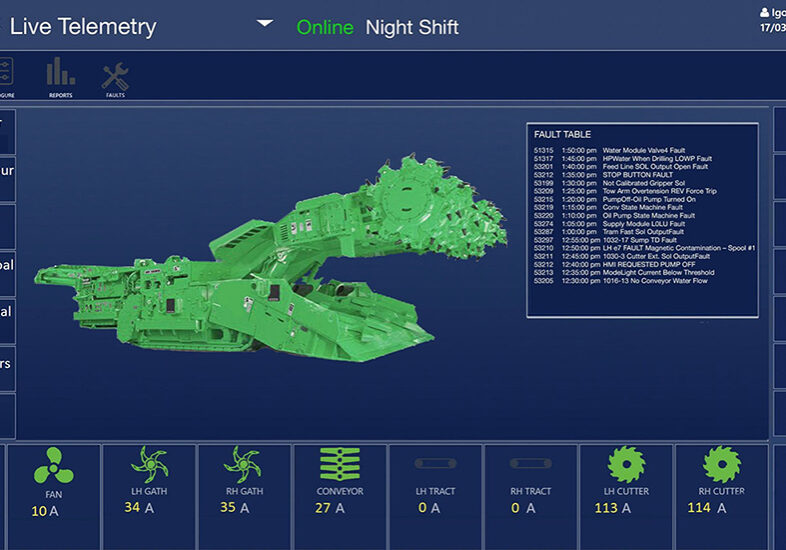
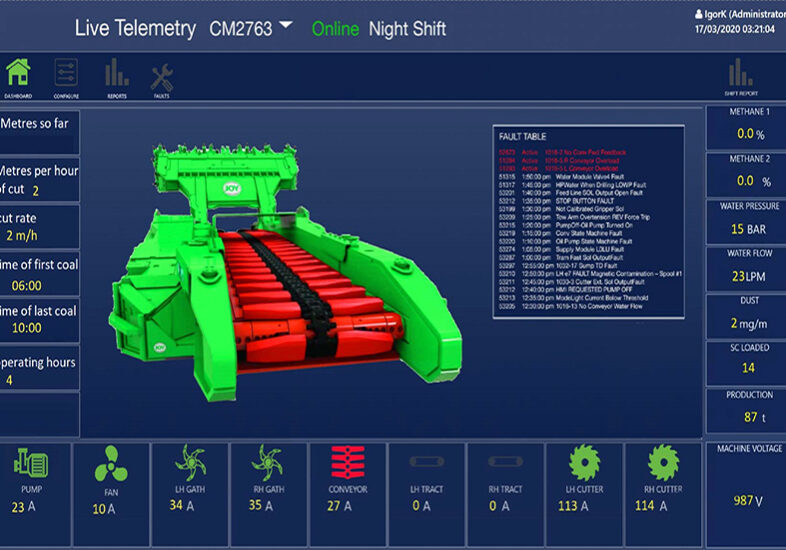
Live, reliable, future proofed, user driven reporting, available anywhere.
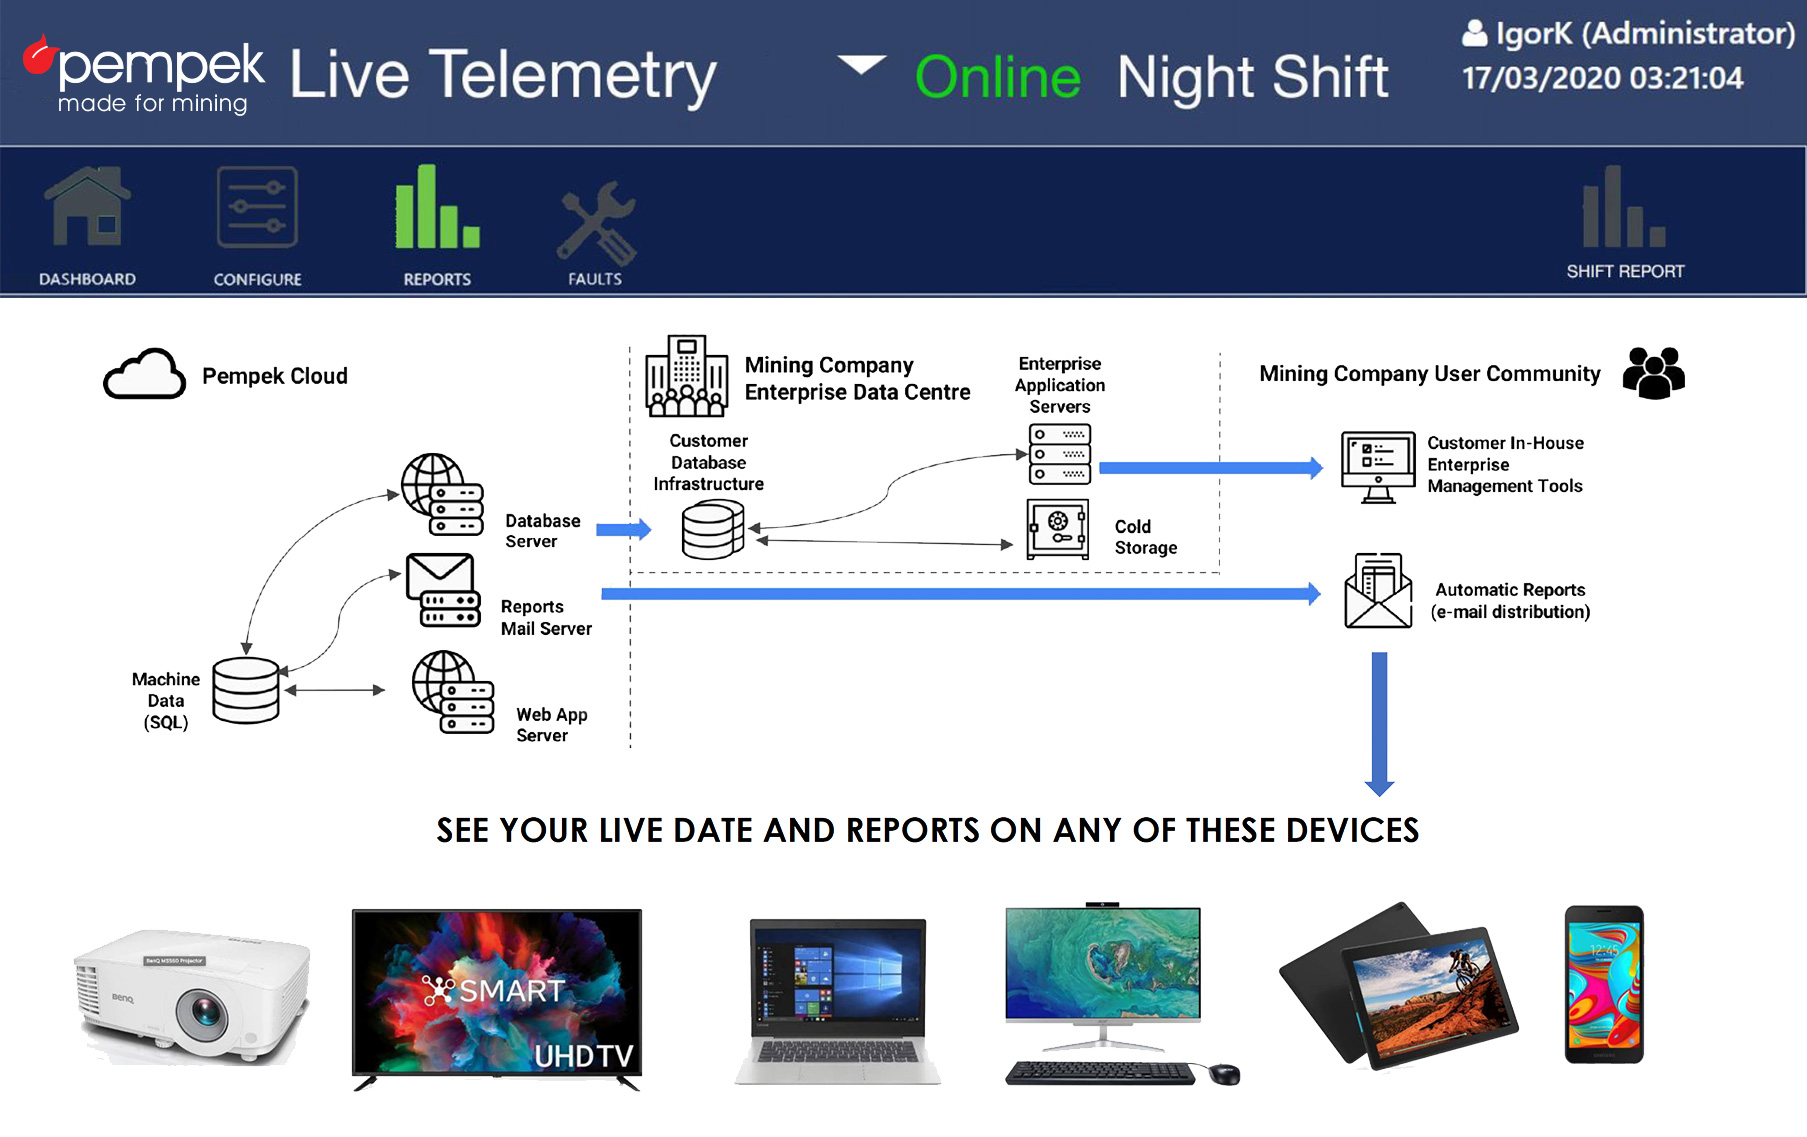
Collects live data from a range of machines (CM, BM, SC, Bolters, Conveyors)
Presents the data live across a range of display devices in a range of formats
Buffers data during network dropouts, no loss of data!
A VAST RANGE of standard and user-driven report generators
Visually clear and intuitive, with simple navigation and control mechanics
Web browser interface to support PC, Laptop, Tablet & Smartphone
Permission levels to present reports and query tools appropriate to different staff
Future-proofed to support future changes in hardware & operating systems.
Already CLOUD ready, no need for server hardware on-site.
IS optimised for existing Pempek Ecosystem & Nautitech modem
Lessons learnt -guide future fault response!
When querying a specific fault, a notes tab will come up displaying information previously stored on the fault.
The user can edit the notes on the fault that can be used to guide future responses to the same fault recurrence.
Include helpful hints from people who previously troubleshot the issue and allows you to set a bread crumb trail for people who query the fault after you in order to speedily resolve it!
As more sites come online with the system, more information on particular faults can be collected.
If permission is granted it, will allow sites to share fault information meaning technicians will avoid double work.
Eventually, this will develop into a robust troubleshooting library, where any issue will have been seen before, and have some information on the issue stored.
This database will also serve as a means of evaluating machine function and highlight recurring issues and areas for improvement.
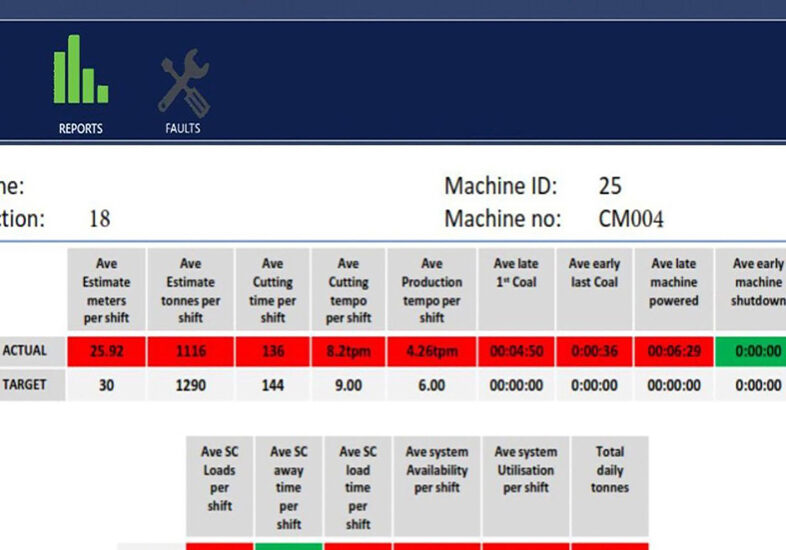
A vast range of pre-configured reports
Pre-configures high-quality production reports make it easy to estimate shift outputs, makeshift comparisons, and improve business processes.
Set your mission goals and validate their completion using these reports.
Provides an intuitive platform which users can configure including:
Troubleshoot issues with a machine fault report
Generate custom graphs based on selected data
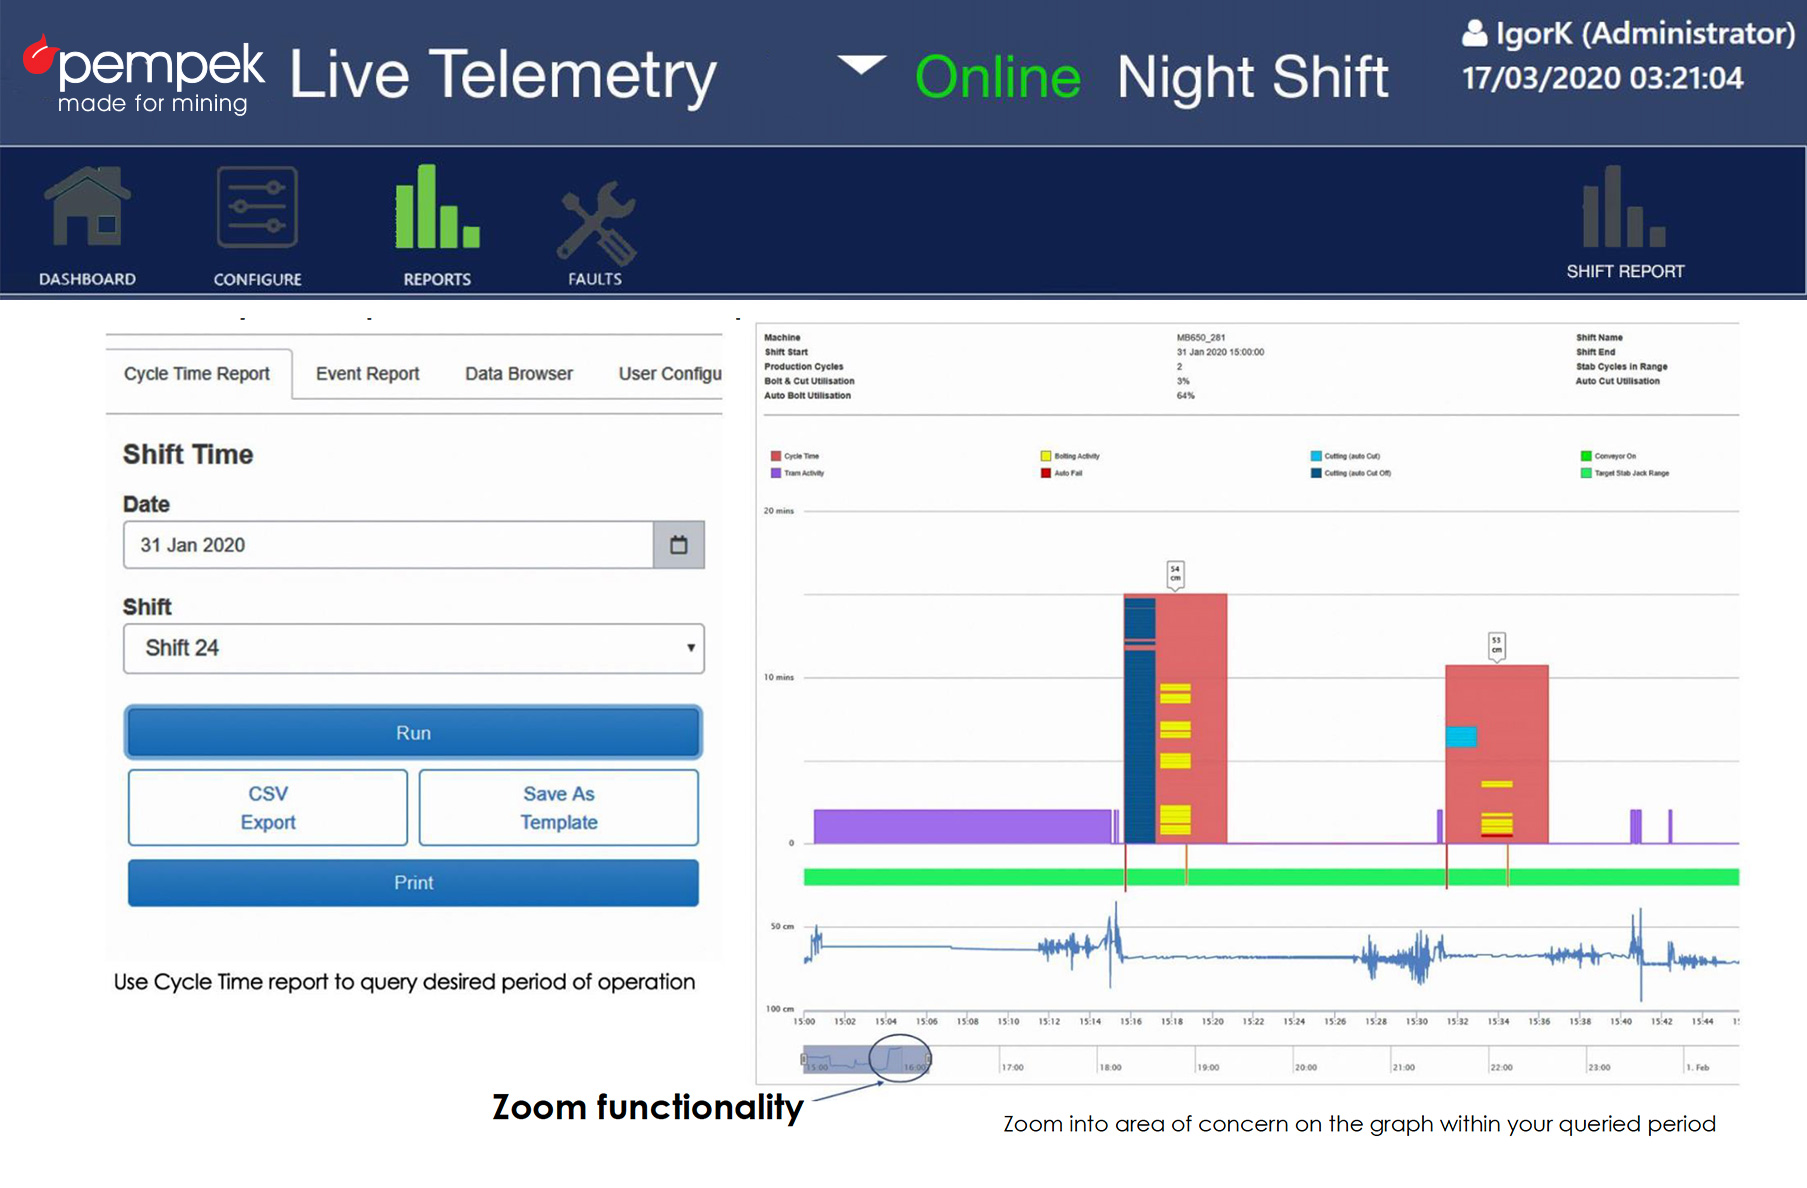
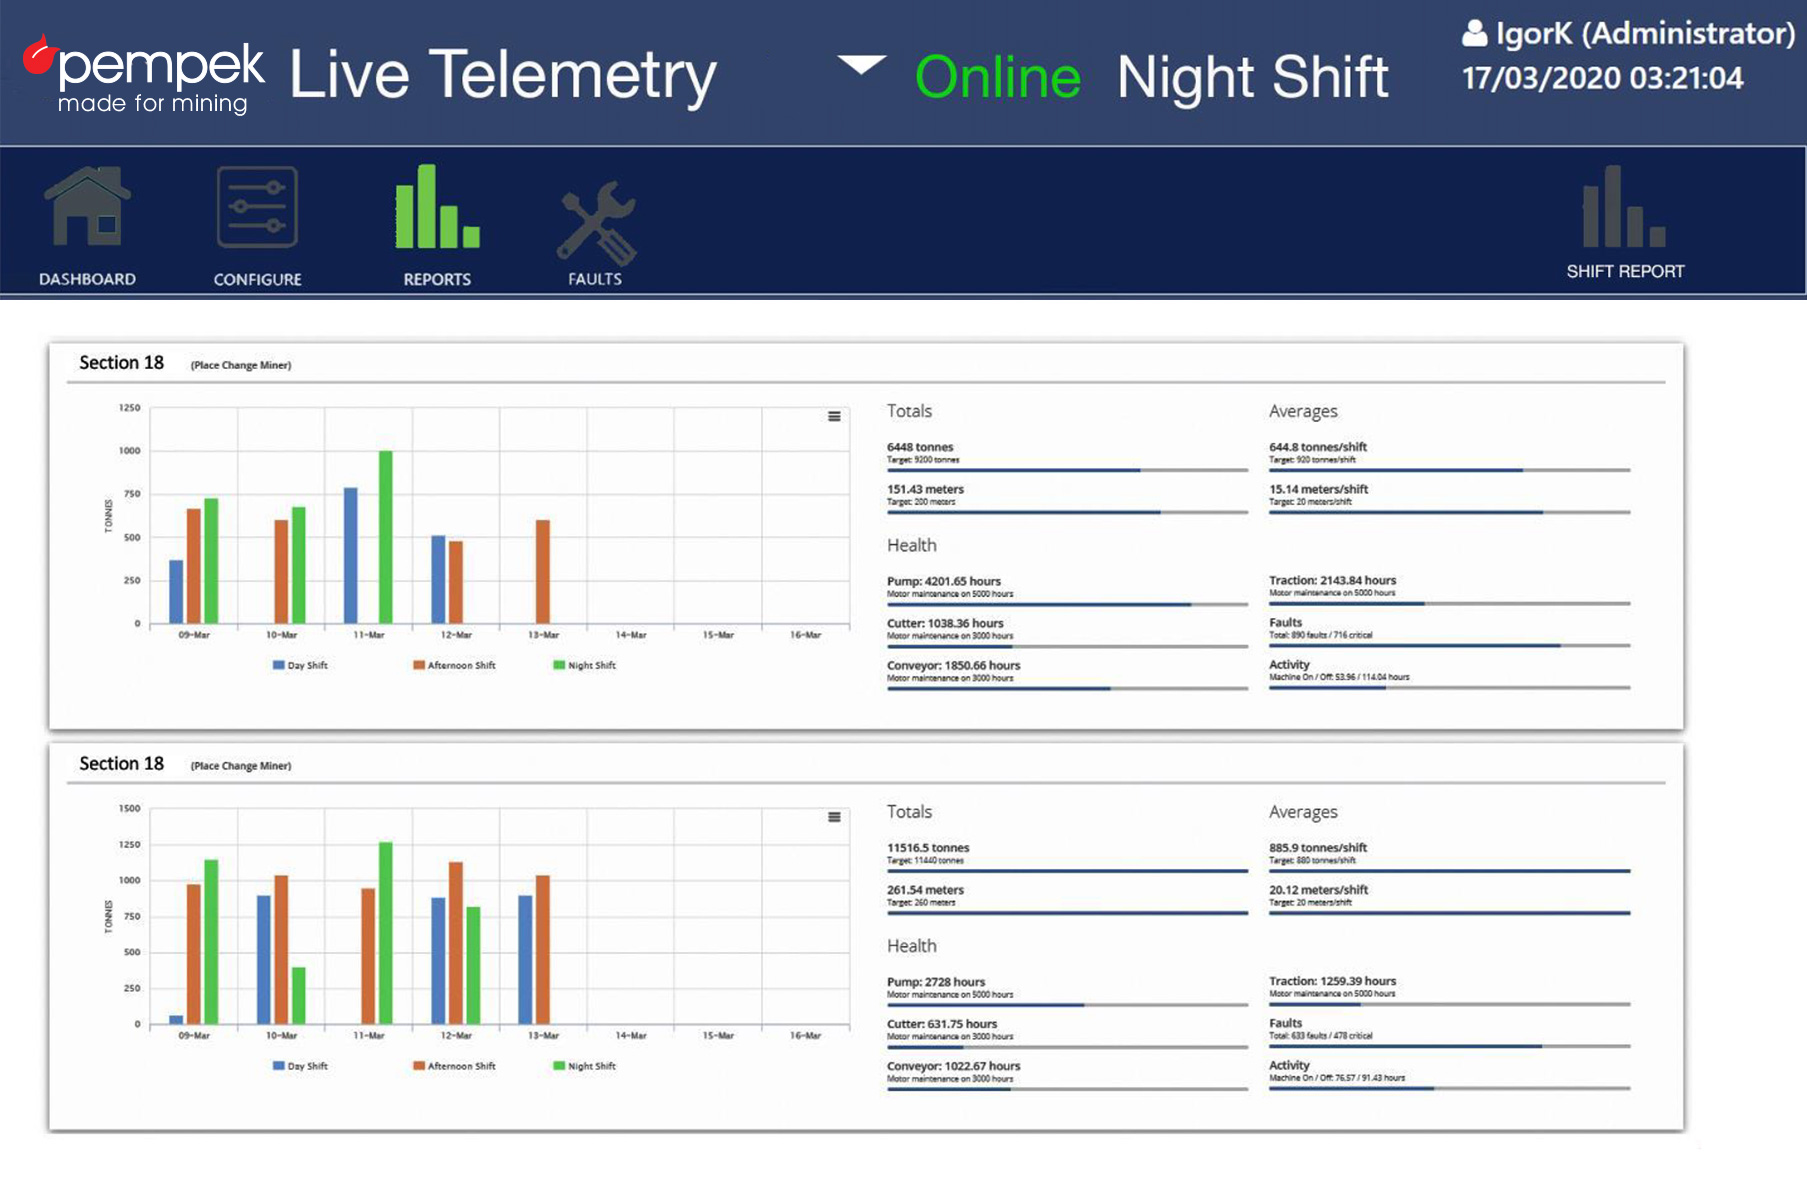
Generate historic production graphs based on the period of your choosing
Query all events that occurred in a machine over a specific period
And a number of other useful applications.
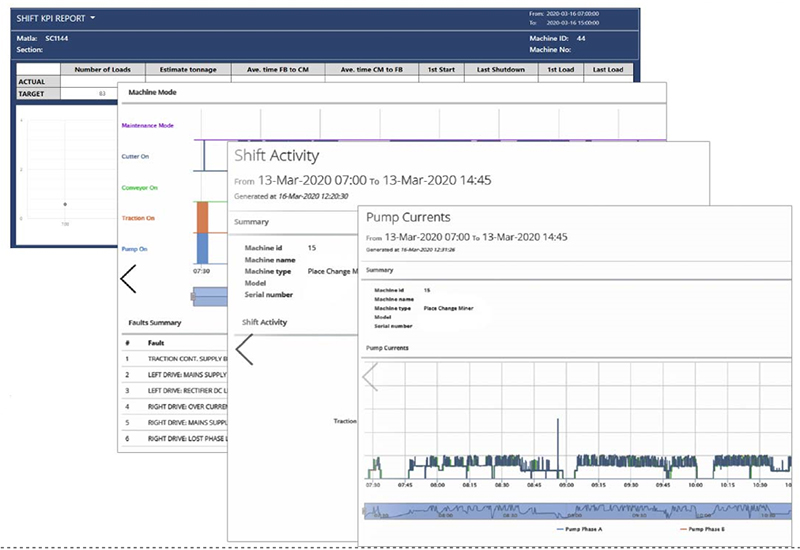
Analytics to maximise productivity
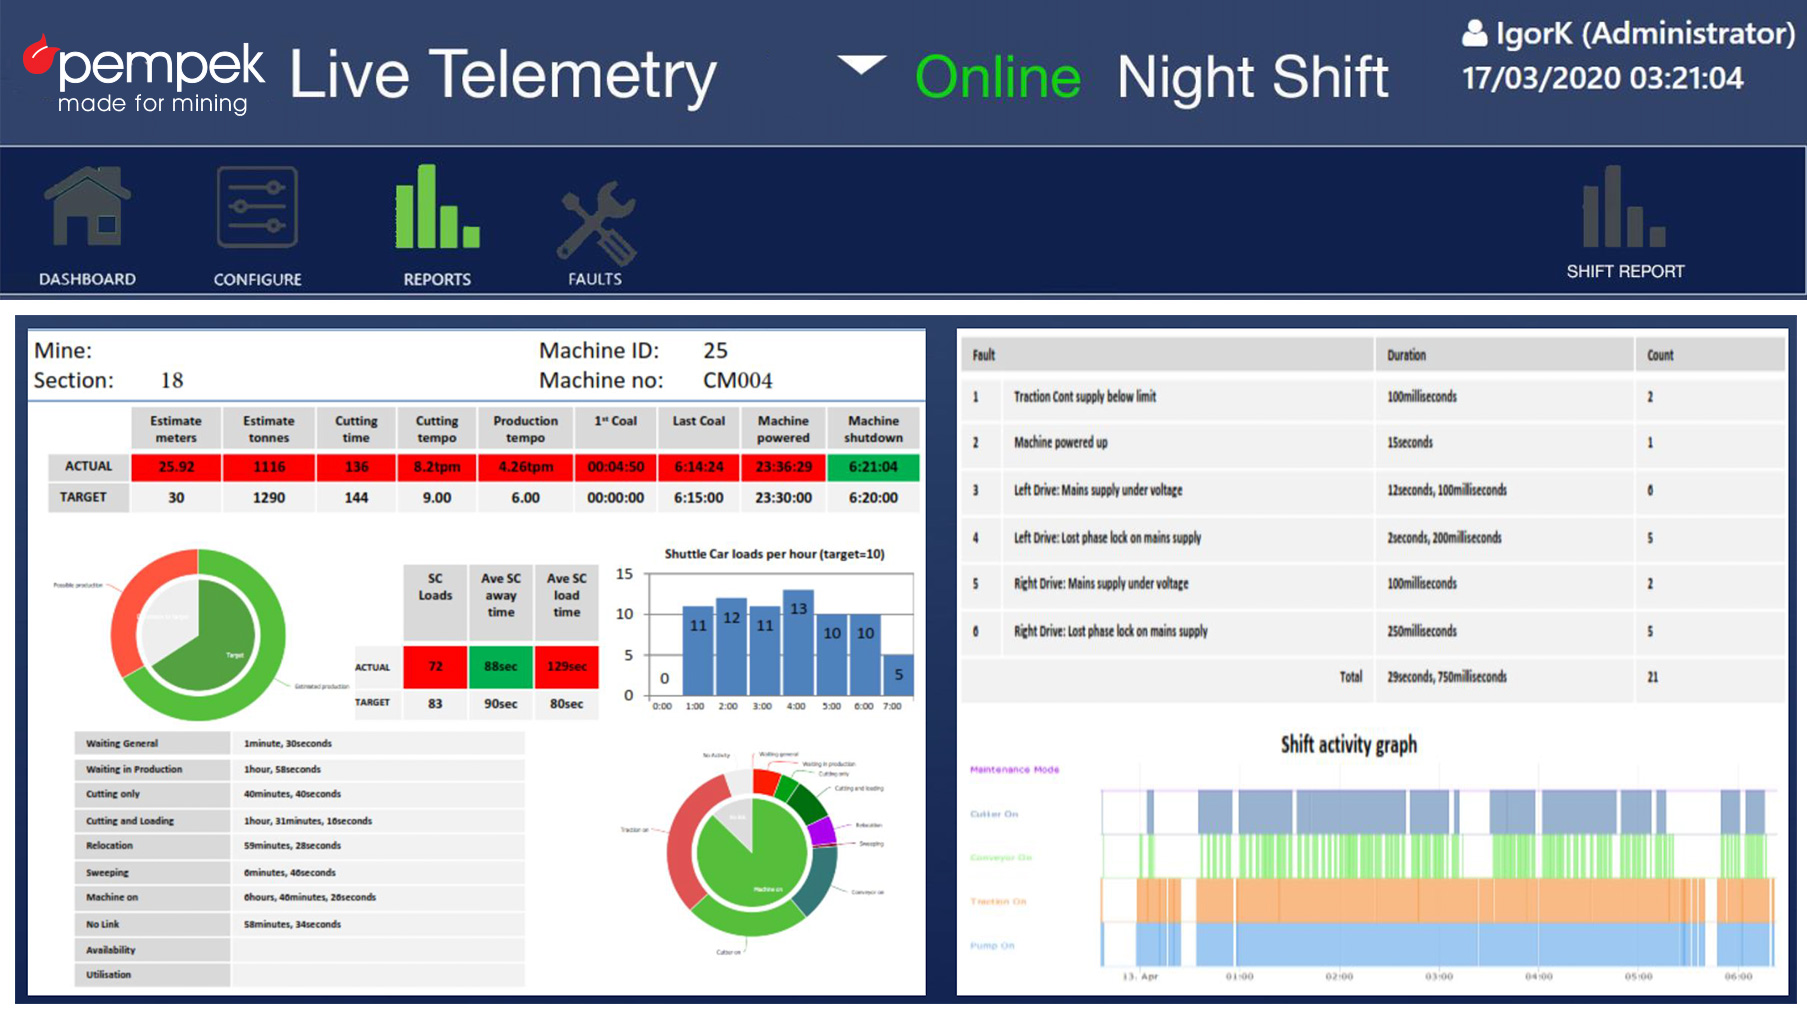
Activity and Production reports by shift provide you the analysis to improve production by identifying downtime and parameters for maximum production.
Event history -Highlights notable machine events
Recent Fault - Details on last 20 active faults
Cycle Time - Graphical break down of cutting cycle
User Configurable elements are charted
Custom -Custom report requests available
Analytics to maximise
productivity
Highly detailed graphical outputs to
compare periods
Shift
Summary
Live data displayed
on any device!
